A summary of Swift, NICER, XMM and eROSITA analysis of ASASSN-20qc to-date
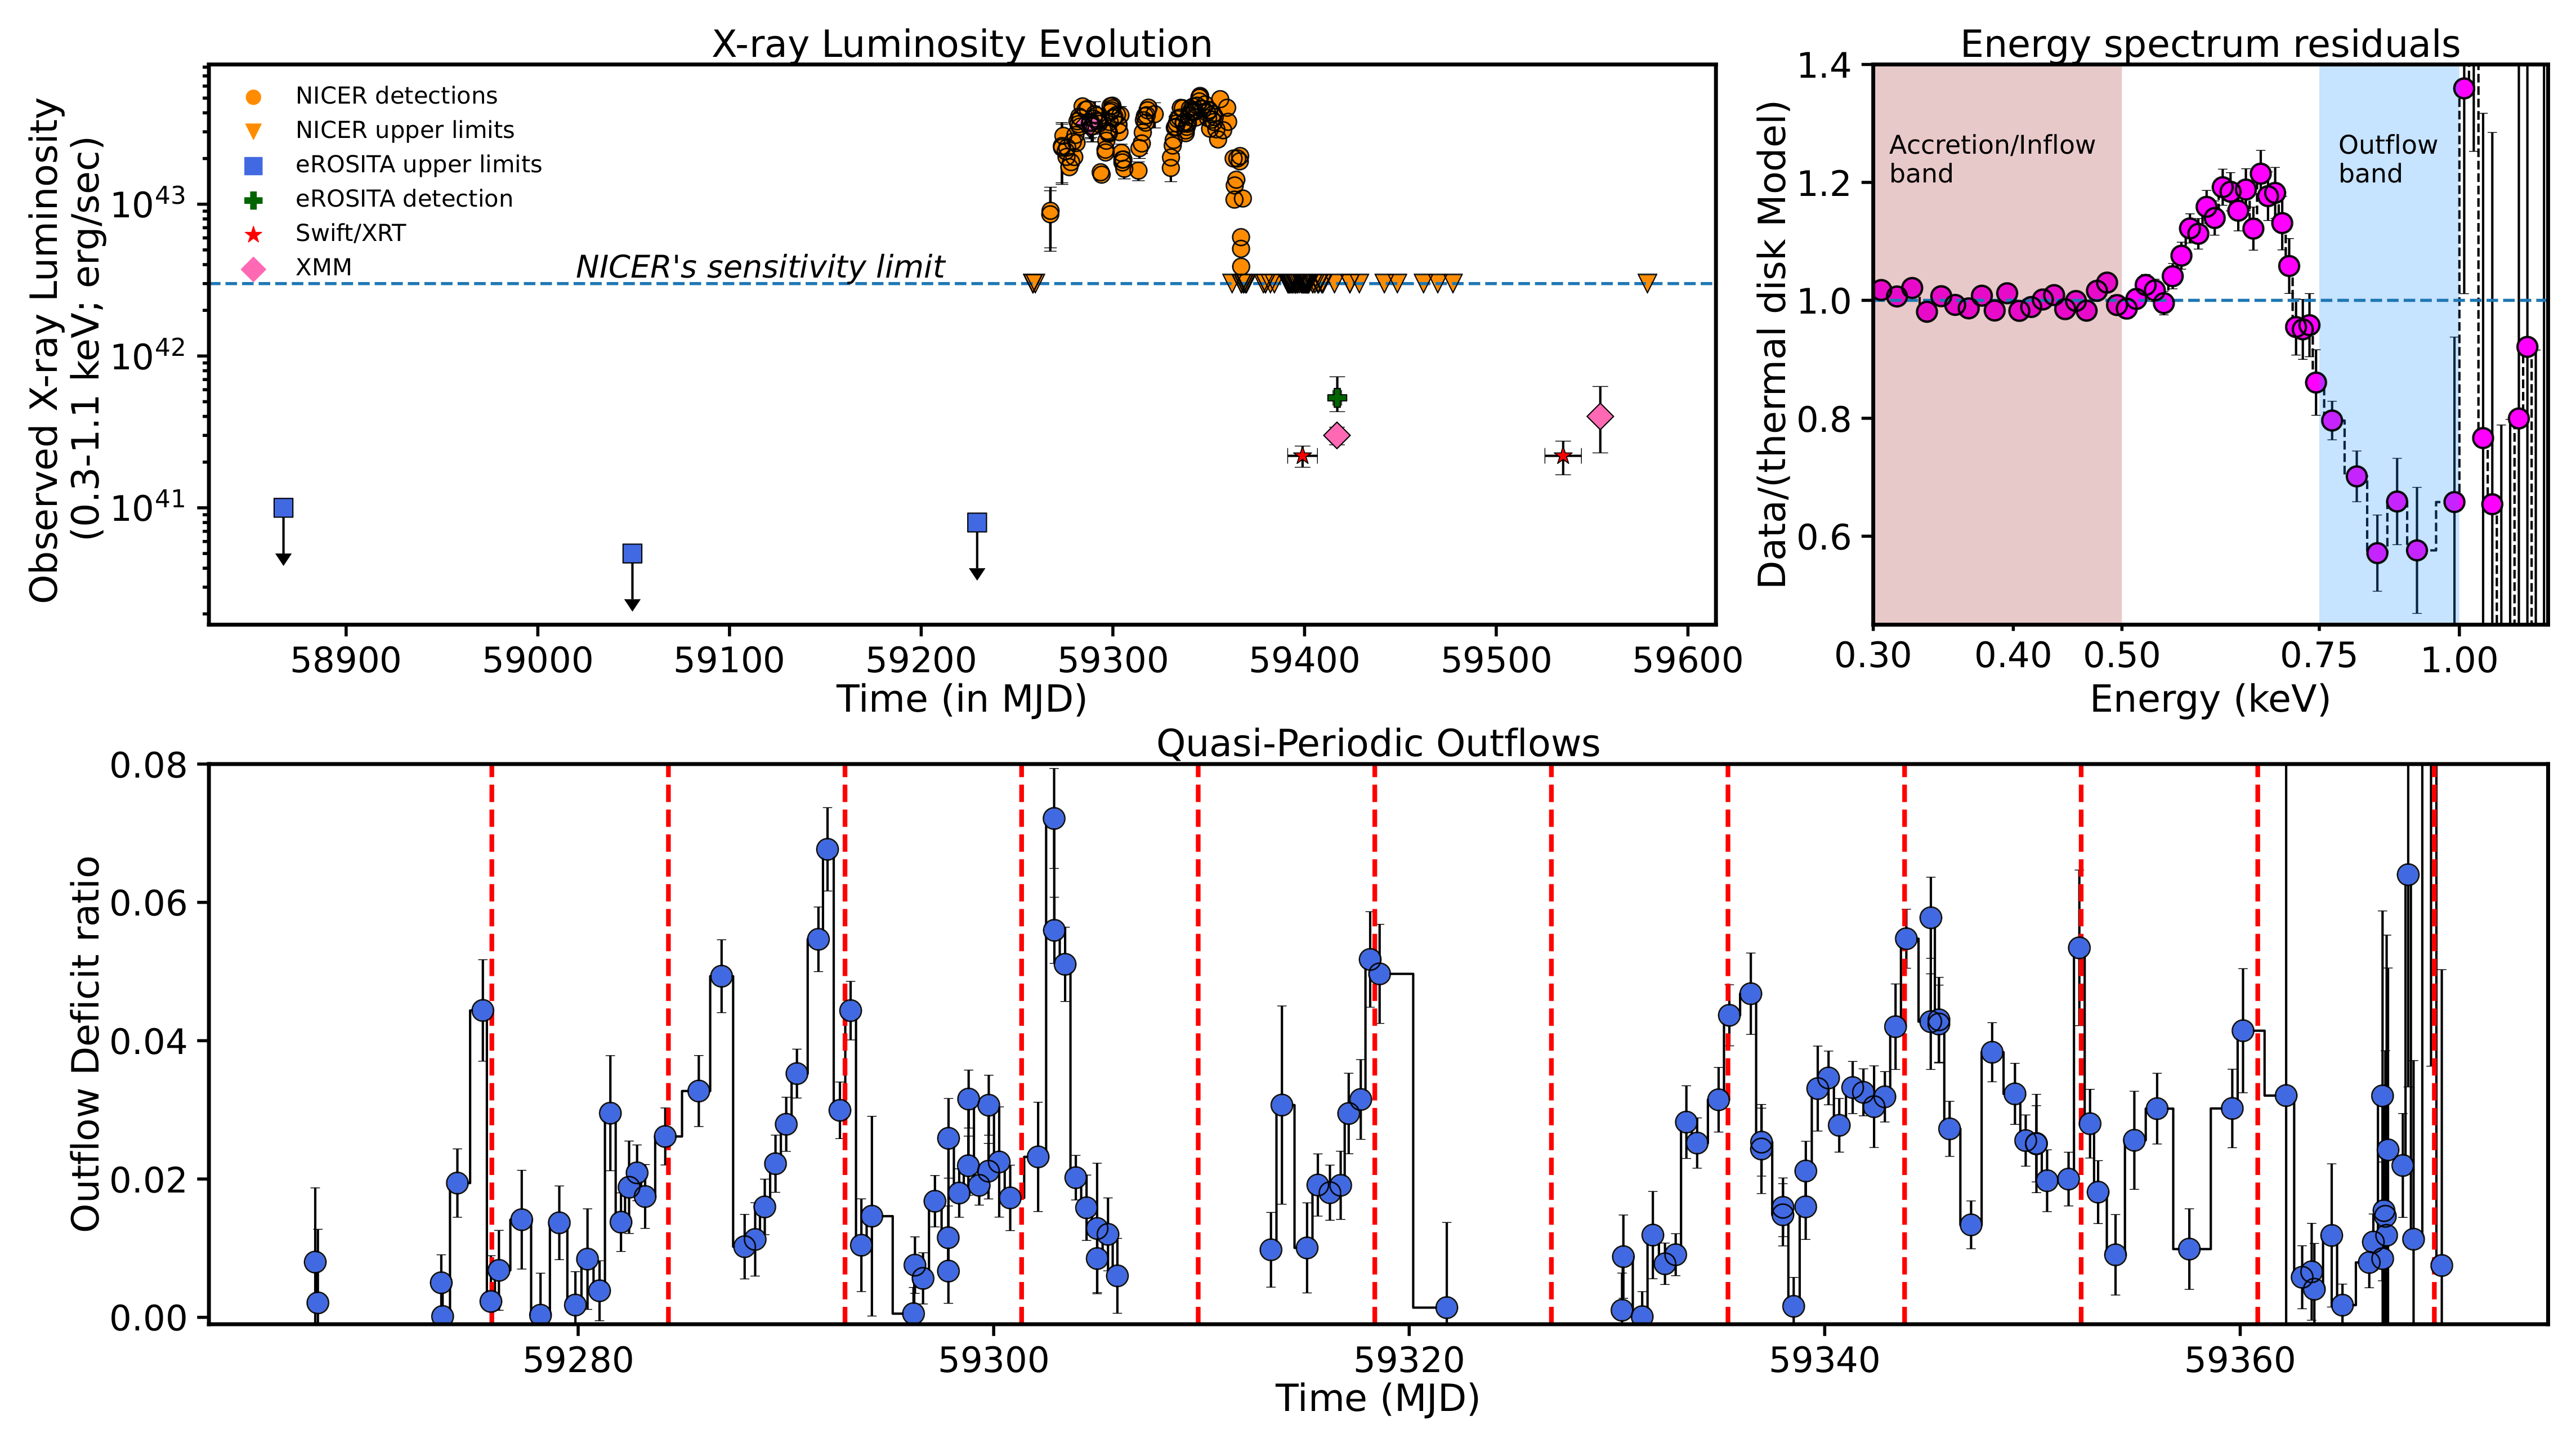
TOP LEFT: Observed 0.3-1.1 keV X-ray light curve of ASASSN-20qc. TOP RIGHT: Ratio of the data over the best-fit thermal disk model. The absorption line between 0.75-1 keV is evident. The emission like feature near 0.6 keV is an artifact of the absorber bending the continuum. The energy spectrum used for this was obtained by combining all NICER data from the minima in the ratio plot show in the bottom panel. The first XMM exposure was taken on MJD 59287 and its spectrum shows similar residuals but with a weaker outflow. The most recent XMM spectrum during the low flux state also shows evidence for the outflow. The proposed XMM exposures are necessary to confirm if an outflow indeed exists in the low flux state. BOTTOM: Ratio of flux in the 0.75-1 keV to 0.3-0.5 keV showing the regular, recurring bursts of increase. The vertical lines are uniformly separated by 8.5 days.