Analysis Software
| Home |
| Research |
| CXC Support |
| >Analysis Software |
| Arcus support |
| ISIS |
 |
 |
Analysis Software
Most of my interactive analysis, testing, and research scripts are done with ISIS. These grow out of research projects, but have (or may) become supported CIAO-contributions.- aglc:
ACIS/Grating Light Curve; a suite to compute light or phase curves
from ACIS/grating data (HETG or LETG).
-
triplet_fit.sl:
Direct fitting of Helium-like line ratios, for density and temperature
diagnostics.
44 Boo light curve (black), hard and soft light curves (blue or red), hardness ratio (blue & red), soft-filtered phase curve (red), and exposure function. 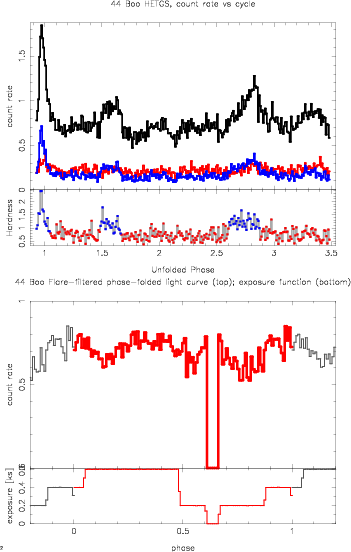
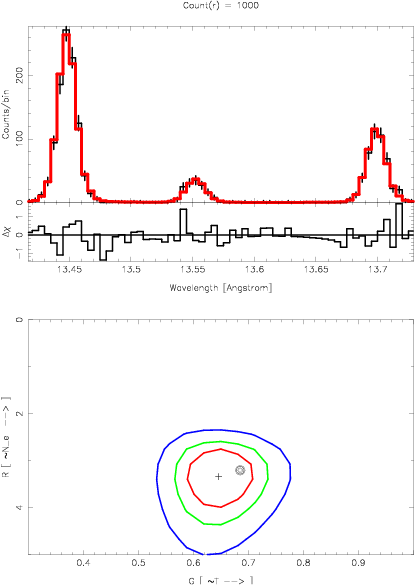
Simulated O VII triplet (black), fit (red), residuals (black), and confidence contours (red, green, blue) of G=(f+i)/r (y-axis) and R=f/i (x-axis) ratios.
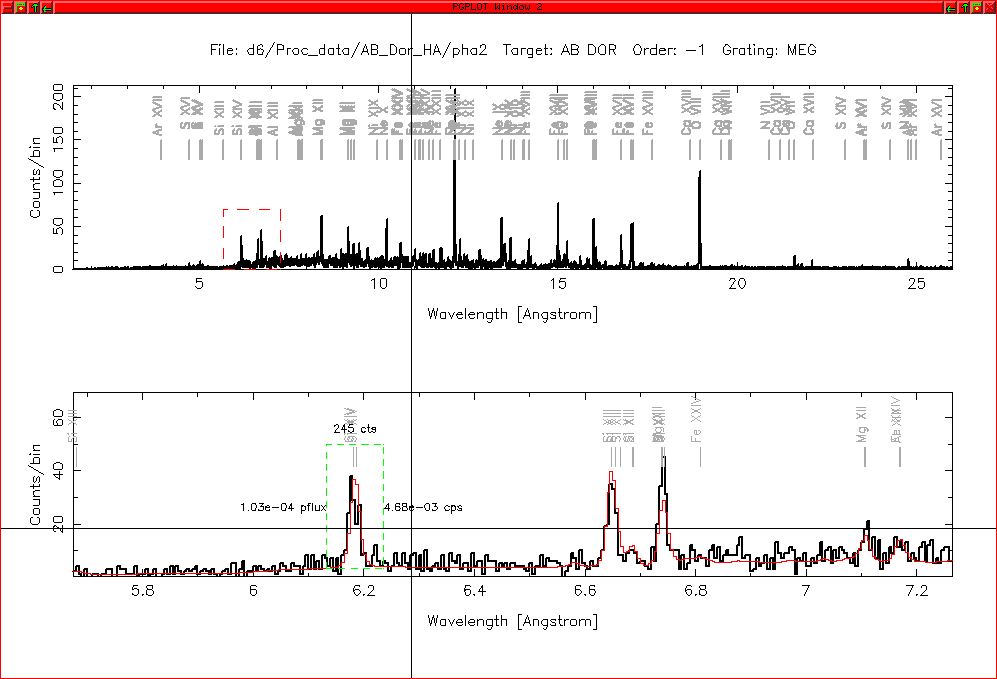
- tgplot.sl: Interactive browsing and
measurement of Chandra grating spectra. Defines thermal plasma model
for line identification, measures flux in regions, produces line-lists
and hard-copy.
Demos and Examples
- Simulation and line ratios: A demonstration of some key
ISIS functions for use in simulating spectra, measuring lines, and
comparing measured ratios to theoretical isothermal values (2007.05).

summary memo
The full ISIS/S-Lang script
Software in Progress
Some analysis software in various stages of development are listed below. They are available as-is on request (i.e., limited documentation and support; subject to change.)- CLP.sl: Composite Line Profile analysis, for summing many
weak lines for improved centroids vs phase or time. An example was
shown in a
Chandra
Newsletter (Figure 16).
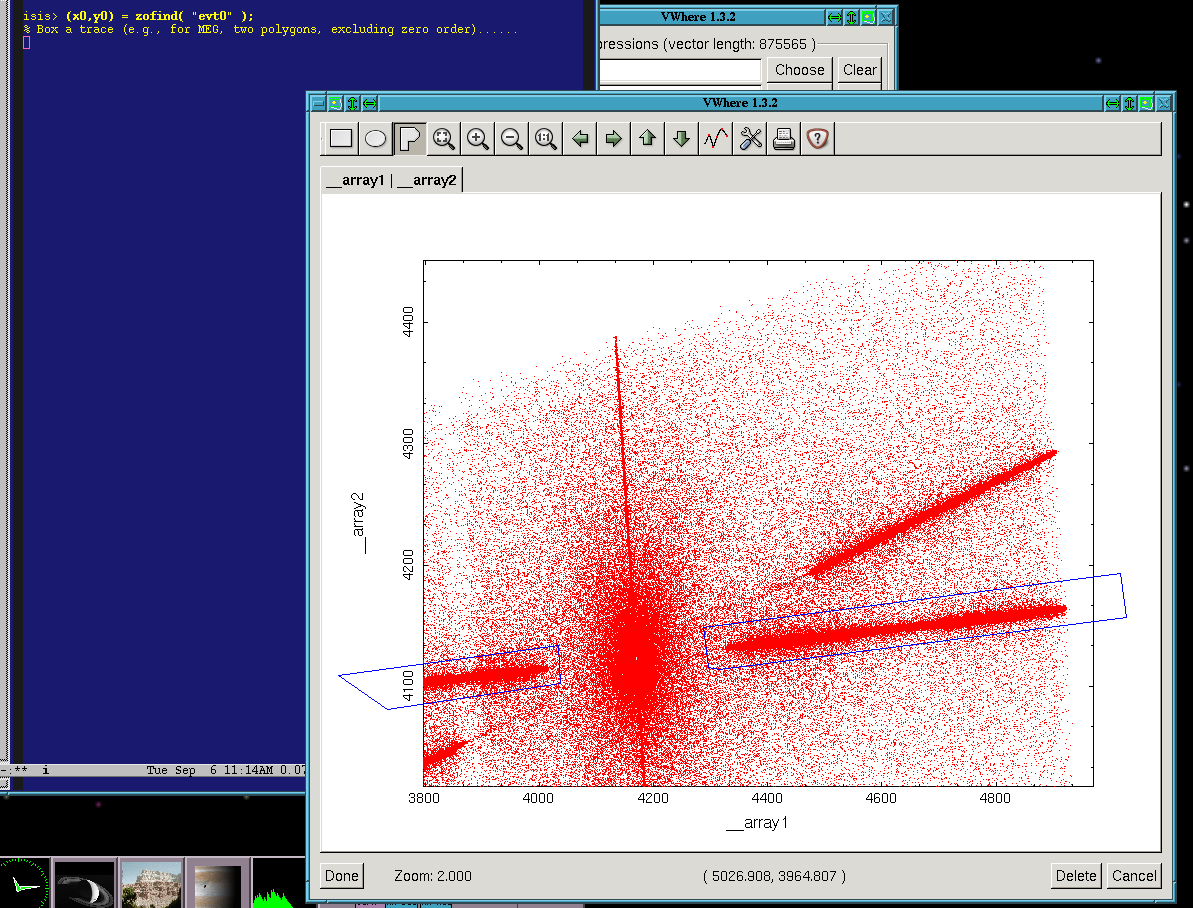
- zofind.sl: Interactively find the
zero order centroid via the intersection of a grating arm's events and
the CCD streak events. This requires the
GTK module and its
vwhere
interactive filter function.
- lfree.sl: Line-free region and continuum modeling support.
Determines model- and instrument-dependent line-free regions from APED
plasma models in ISIS.
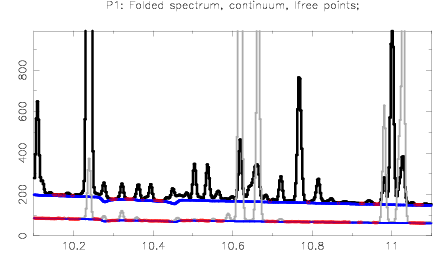
The figure shows two different thermal models in black and gray (at instrumental resolution), and continuum in blue, with line-free intervals in red, as determined from a ratio of line plus continuum to continuum-only models. Line-free regions are returned as bin-lists which can then be "noticed" and fits done to continuum-only bins in order to derive continuum models for more accurate line-flux measurements. The regions are computed for any given plasma model, instrumental response, and selectable significance threshold. The continuum model may be chosen from the true continuum or true plus pseudo-continuum (sum or weak lines), as available in the APED.