

back to HETG at XRCF
(Final analysis, 7/24/1999)

|

|

|
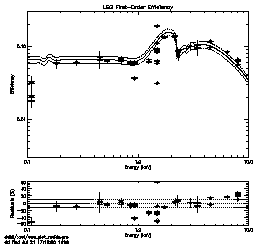
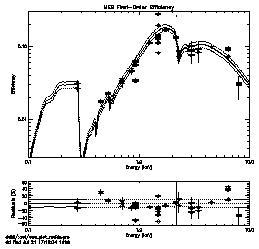
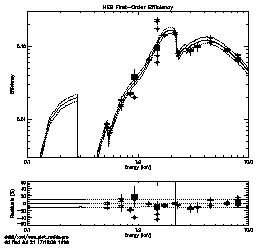
The plots above and in the tables below show the results of analysis of the XRCF Phase 1 EIPS grating effective area and efficiency measurements; hence the prefix "eae_" in the filenames. The measured efficiencies are the ratio of grating-in to grating-out measurements corrected for the effects of a non-monochromatic source.
A summary listing of the data sets analyzed including links to the simultions which produced the "feature fraction" corrections is available:
- eae_wfracs.html
- Summary listing of the file eae_wfracs.rdb. MARX simulation plots are linked from the aperture field. The "Effic." column is the measured efficiency; the "Fractions" column gives the "feature-fraction" corrections to grating-in and grating-out measurements that were applied.
The final results of the analysis are available in the rdb files:
- eae_wfracs.rdb
- The final results table of the eae analysis in rdb format.
- feature_fractions.rdb
- feature fractions companion file to eae.rdb
For a detailed description of the data and analysis methods see: Section 7.4 of the HETG Ground Calibration Report or the July, 1998 SPIE paper (2.4 Mb .ps)
A detailed discussion of the Feature-Fraction Corrections is available:
The following plots were made from the final results file eae_wfracs.rdb by the IDL procedures eae_plots.pro and eae_plot_resids.pro, see below for more details.
| Optic \ Order | 0-Order | 1st-Order |
|---|---|---|
| HRMA | (.ps) | N/A |
| HRMA-MEG | (.ps) | (.ps) |
| HRMA-HEG | (.ps) | (.ps) |
| HRMA-LEG | (.ps) | (.ps) |
The largest systematic effect will be due to the non-monochromatic nature of the source: the grating-in measurement measures only photons in and around the line as opposed to continuum and other nearby lines. This effect does not contribute as much to zero-order measurement error. Its effect on the first-order measurements is most pronounced for the complex L-lines.
As described below, feature-fraction corrections have been applied to correct the measured efficiencies in the plots and tables below. These corrections also correct the results for the finite aperture size, in particular the LEG efficiencies are for the full PSF including the support structure diffraction pattern; these LEG efficiencies are the 'N0003 values.
| Optic \ Order | 0-Order | 1st-Order | 1st&0th (at top of page) |
|---|---|---|---|
| HRMA-MEG | (.ps) (.gif) | (.ps) (.gif) | (.ps) |
| HRMA-HEG | (.ps) (.gif) | (.ps) (.gif) | (.ps) |
| HRMA-LEG | (.ps) (.gif) | (.ps) (.gif) | (.ps) |
In order to analyze and compile the range of Effective Area / Efficiency data and results from XRCF grating measurements, a data table format was devised (and may be modified or extended.) This table is in rdb format. The xrcf_data.fmt file, below, describes the various columns in some detail. Goals of this data table process include i) that it have sufficient information to allow automated retrieval of data files, ii) values can be traced and sanity checked, iii) sufficient ancillary information is available to make various informative plots.
All operations are performed through IDL routines to minimize manual operations (though a lot of manual "knowledge" is included/encoded in the routines and key files) and to allow the analysis to be redone automatically. [See eae_do_it_all.pro, below.]
The IDL procedures used for the processing are described below in the order that they are applied. Here the steps are summarized with example output.
Effective area measurements (except monochromator scans) of 1st and 0 orders (and related no-grating measurements) were selected from the req_run cmdb by eae_fill_from_cmdb.pro.
The selected CMDB lines were then used to create an eae rdb file. This file has only the columns filled in that can be determined from the CMDB (trw_id, grating, etc.) and it has one line per TRW ID. By using eae_fill_runids.pro the date code, runids, etc. were added to the eae file "eae_wids.rdb".
The file eae_wids.rdb has enough information in it to allow the retreival and analysis of the MST data for selected lines by the routine eae_pha_anal.pro. At this point multiple iterations are detected and the output file, eae_wcounts.rdb, will now have a line per iteration.
Currently counts-in-the-bump are extracted using simple ROI analysis performed using the raw .pha data files by eae_pha_anal.pro. Note that the ROI to use is spelled out for all detectors in the routine eae_roi.pro.
The counts could also be supplied at this point from XSPEC analysis results, if available. Also, eae_pha_anal will be modified to use gaussian fitting with a modelled continuum.
After the multiple iterations have been "expanded", the procdure eae_fill_order.pro can be run to assign the diffraction order to the runid/iteration. With the counts available, they can be turned into fluxes and effective areas by eae_flux_anal.pro. This routine makes use of eae_bnd_hrma_area.pro to get the various BND effective-at-HRMA areas. This routine also has logic for what to ratio to use for the effective area: currently choosing to ratio FPC_X2 to FPC_HN if available (FPC_5 if not) and ratioing SSD_X to SSD_5 if available (then FPC_HN, FPC_5 if not).
Finally, for grating analysis, the ratio of grating in to grating out can be formed. The routine eae_fill_refs.pro reads a manually created data file that specifies what TRW_IDs should be used as reference (grating-out) measurements for which grating-in TRW_IDs. Then the relevant reference values are calculated/copied by eae_update_ref_vals.pro. Finally the actual efficiency is calculated as the ratio of the measured effective area value to the reference value by eae_effic_anal; setting /FRACTION and supplying a "feature_fractions" structure (from feature_fractions.rdb) will have the feature-fraction corrections applied. See the feature-fractions discussion for more information.
The final result is the eae table eae_wfracs.rdb (available at SAO in /home/dd/data/eae/ and at MIT in /nfs/spectra/d6/eae/ .)
The eae s/w is primarily in ~dd/idl/xrcf/ at MIT and SAO, with exceptions as noted. The details of the feature-fraction correction s/w are given on the Feature-Fraction Corrections page, creating the "feature_fractions.rdb" file used by eae_effic_anal.pro.
The prime output product is the eae_wfracs.rdb file. Summaries of this file and plots of its data are made using:
The work-horse routines are listed below in roughly the order in which they are used on the data:
trw_id                 use single TRW ID as reference
trw_id*factor          use TRW ID with a correction factor
trw_id+trw_id          add two or more reference IDs
trw_id+trw_id*factor   add two or more ref IDs and apply a correction factor
blahblah = value       use the value given here as the reference
in order to take into account the differences in shutters between the with and without grating measurements. Special cases are also be coded here.
This page is http://space.mit.edu.ezproxyberklee.flo.org/HETG/eae/eae.html
Return to http://space.mit.edu.ezproxyberklee.flo.org/HETG/xrcf.html
MIT Accessibility